Olivier,
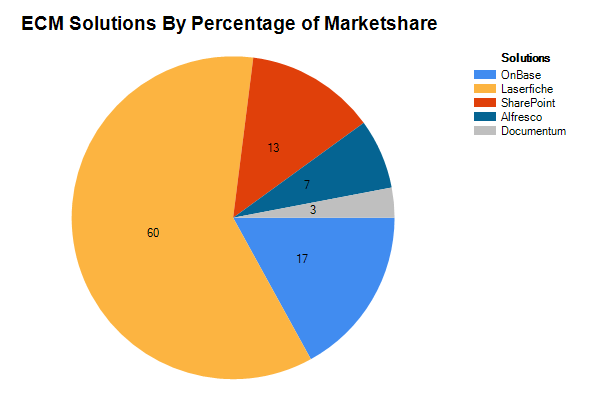
Here is a start on some SDK Script activity code to create a pie chart and save it as a page in a document.
You must add references to System.Drawing, System.Windows.Forms, and System.Windows.Forms.DataVisualization to the script activity.
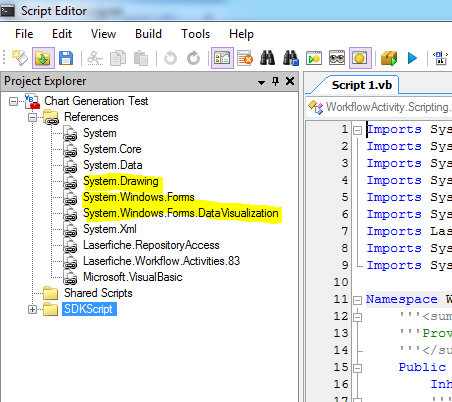
You must also make sure the assemblies are correctly referenced in the script
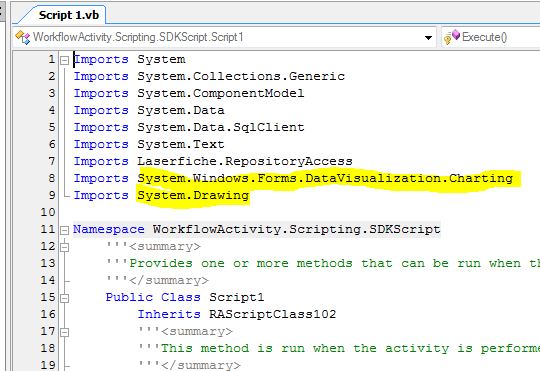
Here is the actual script...
Imports System
Imports System.Collections.Generic
Imports System.ComponentModel
Imports System.Data
Imports System.Data.SqlClient
Imports System.Text
Imports Laserfiche.RepositoryAccess
Imports System.Windows.Forms.DataVisualization.Charting
Imports System.Drawing

Namespace WorkflowActivity.Scripting.SDKScript
    '''<summary>
    '''Provides one or more methods that can be run when the workflow scripting activity is performed.
    '''</summary>
    Public Class Script1
        Inherits RAScriptClass102
        '''<summary>
        '''This method is run when the activity is performed.
        '''</summary>
        Protected Overrides Sub Execute()

            'Get the tokens for values and labels...
            Dim valuesToken as List(Of Object) = Me.GetTokenValue("ChartValues")
            Dim labelsToken As List(Of Object) = Me.GetTokenValue("ChartLabels")
            Dim count As Integer = valuesToken.Count-1

            'Convert the multivalue tokens to arrays...
            Dim chartValues(count) As Double
            Dim chartLabels(count) As String

            For i As Integer = 0 to count
                chartValues(i) = CDbl(valuesToken(i))
                chartLabels(i) = labelsToken(i).ToString
            Next

            'Create a new chart...
            Dim chart As Chart = New Chart()
            chart.Width = 600
            chart.Height = 400

            'Add a title to the chart...
            Dim title As New Title(Me.GetTokenValue("ChartTitle"))
            title.Alignment = ContentAlignment.TopLeft
            title.Font = New Font("Arial", 14, FontStyle.Bold)
            chart.Titles.Add(title)

            'Add the legend for the data...
            Dim legend As New Legend(Me.GetTokenValue("LegendTitle"))
            chart.Legends.Add(legend)

            'Create a new data series and set the chart type to a pie chart...
            Dim series As Series = New Series("Default")
            series.ChartType = SeriesChartType.Pie
            series.IsValueShownAsLabel = True
            chart.Series.Add(series)

            'Bind the labels and values as datapoints...
            chart.Series("Default").Points.DataBindXY(chartLabels, chartValues)

            'Create a new chart area and add it to the chart object...
            Dim chartArea As ChartArea = New ChartArea()
            Dim yAxis As Axis = New Axis(chartArea, AxisName.Y)
            Dim xAxis As Axis = New Axis(chartArea, AxisName.X)
            chart.ChartAreas.Add(chartArea)

            'Now write the chart image to the document...
            Using docInfo As DocumentInfo = Me.BoundEntryInfo()

                'Read the chart image into a byte array...
                Dim imageData() As Byte
                Using ms As New System.IO.MemoryStream
                    chart.SaveImage(ms, ChartImageFormat.Tiff)
                    imageData = ms.ToArray
                End Using

                'Lock the document and append a blank page...
                docInfo.Lock(LockType.Exclusive)
                Dim pInfo As PageInfo = docinfo.AppendPage

                'Write the image to the new page...
                Using writer As System.IO.Stream = pInfo.WritePagePart(PagePart.Image, imageData.Length)
                    writer.Write(imageData, 0, imageData.Length)
                End Using

                'Save and unlock the document...
                docInfo.Save()
                docInfo.Unlock()

            End Using

        End Sub

    End Class

End Namespace
Here is an image of the pie chart created;
I am passing workflow tokens into the script for the data values, data labels, chart title, and legend title as examples to give you some ideas.
There are almost endless possibilities for chart types and features. Here is an MSDN reference to look at some additional options.
https://msdn.microsoft.com/en-us/library/system.windows.forms.datavisualization.charting(v=vs.110).aspx