Hello all,
I am new to javascript and I would like to display pie chart in my forms as per the screenshots.
1- Screenshots: collecting score as per the service
2-Screenshots: need to display pie chart as per Service
Thanks
Best Regards,
Mazahir Naya
Hello all,
I am new to javascript and I would like to display pie chart in my forms as per the screenshots.
1- Screenshots: collecting score as per the service
2-Screenshots: need to display pie chart as per Service
Thanks
Best Regards,
Mazahir Naya
Here's how I've done it. This is using the Google Developers script for pie chart visualization (https://developers.google.com/chart/interactive/docs/gallery/piechart).
You'll need to store the loader.js file (https://www.gstatic.com/charts/loader.js ) in the js folder on your forms server (C:\Program Files\Laserfiche\Laserfiche Forms\Forms\js).
On my form, I added these elements:
1. Table - name: "Service Tasks" - variable: service_tasks_table - CSS Class: serviceTasksTable
1a. Table Column - type: Dropdown - name: Service Type - variable: service_type - CSS Class: serviceTask - Options: Window Cleaning, Table Cleaning, Floor Cleaning, Office Cleaning
1b. Table Column - type: Number - name: Hours Spent - variable: hours_spent - CSS Class: hoursSpent
2. Single Line Field - name: Window Cleaning - CSS Class: windowCleaningTotal hiddenField - fx: =SUMIF(service_tasks_table.service_type,"Window Cleaning",service_tasks_table.hours_spent)
3. Single Line Field - name: Table Cleaning - CSS Class: tableCleaningTotal hiddenField - fx: =SUMIF(service_tasks_table.service_type,"Table Cleaning",service_tasks_table.hours_spent)
4. Single Line Field - name: Floor Cleaning - CSS Class: floorCleaningTotal hiddenField - fx: =SUMIF(service_tasks_table.service_type,"Floor Cleaning",service_tasks_table.hours_spent)
5. Single Line Field - name: Office Cleaning - CSS Class: officeCleaningTotal hiddenField - fx: =SUMIF(service_tasks_table.service_type,"Office Cleaning",service_tasks_table.hours_spent)
6. Custom HTML - HTML: <div id="piechart" style="width: 100%; height: 400px;"></div>
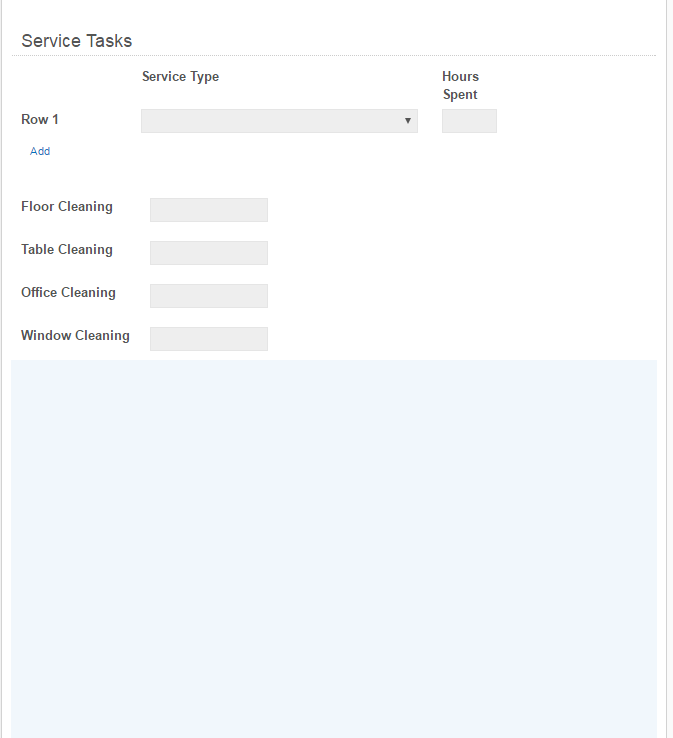
It'll look like this:
Then you'll add this CSS code (which will cause the four totals fields to be hidden):
/*hide any fields with the hiddenField Class*/
.hiddenField {display : none;}
Then you'll add this Javascript code (which will display and update the pie chart each time the Service Tasks table is updated):
$(document).ready(function() {
//load the Google Charts Visualization
$.getScript('http://FORMSERVER/forms/js/loader.js', function () {
});
//when anything in the Service Tasks Table changes, update the pie chart
$('.serviceTasksTable').on('change', function() {
//pie chart update code
google.charts.load('current', {'packages':['corechart']});
google.charts.setOnLoadCallback(drawChart);
function drawChart() {
//get the pie chart values from the hidden totals fields
var windowCleaning = parseInt($('.windowCleaningTotal input').val());
var floorCleaning = parseInt($('.floorCleaningTotal input').val());
var tableCleaning = parseInt($('.tableCleaningTotal input').val());
var officeCleaning = parseInt($('.officeCleaningTotal input').val());
//store the hidden totals fields into the array
var data = google.visualization.arrayToDataTable([
['Task','Hours'],
['Window Cleaning',windowCleaning],
['Table Cleaning',tableCleaning],
['Floor Cleaning',floorCleaning],
['Office Cleaning',officeCleaning]
]);
//set the chart title
var options = {
title: 'Service Tasks'
};
//update the pie chart
var chart = new google.visualization.PieChart(document.getElementById('piechart'));
chart.draw(data, options);
}
});
});
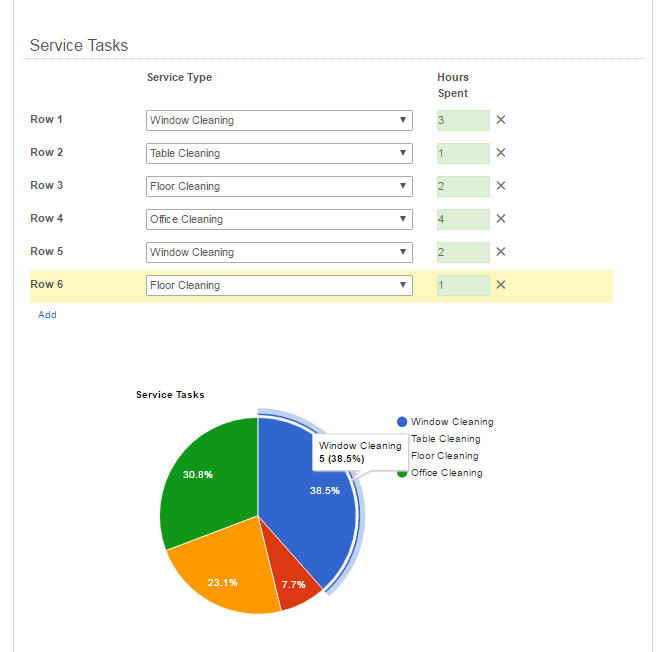
The final form should look like this:
Hello Matthew,
Thank you so much for the reply it is working fine but when I save forms HTML pie chart does not save in forms.
Best Regards,
Mazahir Naya
Sorry - I guess I didn't test past a form preview..
The Javascript is only triggering the form when the table updates, but that wouldn't happen on a secondary view of the form or archival to the repository.
This Javascript should load the pie chart when the form loads and whenever the table is updated:
$(document).ready(function() {
//load the Google Charts Visualization
$.getScript('http://FORMSERVER/forms/js/loader.js', function () {
setTimeout(updatePieChart, 10);
});
//when anything in the Service Tasks Table changes, update the pie chart
$('.serviceTasksTable').on('change', function() {
setTimeout(updatePieChart, 10);
});
function updatePieChart() {
//pie chart update code
google.charts.load('current', {'packages':['corechart']});
google.charts.setOnLoadCallback(drawChart);
function drawChart() {
//get the pie chart values from the hidden totals fields
var windowCleaning = parseInt($('.windowCleaningTotal input').val());
var floorCleaning = parseInt($('.floorCleaningTotal input').val());
var tableCleaning = parseInt($('.tableCleaningTotal input').val());
var officeCleaning = parseInt($('.officeCleaningTotal input').val());
//store the hidden totals fields into the array
var data = google.visualization.arrayToDataTable([
['Task','Hours'],
['Window Cleaning',windowCleaning],
['Table Cleaning',tableCleaning],
['Floor Cleaning',floorCleaning],
['Office Cleaning',officeCleaning]
]);
//set the chart title
var options = {
title: 'Service Tasks'
};
//update the pie chart
var chart = new google.visualization.PieChart(document.getElementById('piechart'));
chart.draw(data, options);
}
}
});
If this works, I can edit my original post to include this Javascript instead - that way it could be marked as the answer to the question.
I try with the latest java code but same result.FY
Sorry about that, the issue is that the form is slightly modified by the system when it is displayed in its read-only version, which is also what is used for archival to the repository.
The core of the issue is in the section where we are gathering the totals to use for the pie chart - the four lines in the middle that look like this:
var windowCleaning = parseInt($('.windowCleaningTotal input').val());
It works in the processing version, but not in the read-only version, because they stop having input fields and have text values instead.
So we need to tweak the code to get the input values when it is in processing, but get the text values instead when it is readonly.
Here's the corrected code:
$(document).ready(function() {
//load the Google Charts Visualization
$.getScript('http://FORMSERVER/forms/js/loader.js', function () {
setTimeout(updatePieChart, 10);
});
//when anything in the Service Tasks Table changes, update the pie chart
$('.serviceTasksTable').on('change', function() {
setTimeout(updatePieChart, 10);
});
function updatePieChart() {
//pie chart update code
google.charts.load('current', {'packages':['corechart']});
google.charts.setOnLoadCallback(drawChart);
function drawChart() {
//get the pie chart values from the hidden totals fields
//populate the values into the four variables
//if the form is in processing mode, get the input field values
//if the form is in read-only mode, get the text values instead
var windowCleaning, floorCleaning, tableCleaning, officeCleaning;
if (parseInt($('.windowCleaningTotal input').val()) >= 0) {
windowCleaning = parseInt($('.windowCleaningTotal input').val());
}
else {
windowCleaning = parseInt($('.windowCleaningTotal .cf-field').text());
}
if (parseInt($('.floorCleaningTotal input').val()) >= 0) {
floorCleaning = parseInt($('.floorCleaningTotal input').val());
}
else {
floorCleaning = parseInt($('.floorCleaningTotal .cf-field').text());
}
if (parseInt($('.tableCleaningTotal input').val()) >= 0) {
tableCleaning = parseInt($('.tableCleaningTotal input').val());
}
else {
tableCleaning = parseInt($('.tableCleaningTotal .cf-field').text());
}
if (parseInt($('.officeCleaningTotal input').val()) >= 0) {
officeCleaning = parseInt($('.officeCleaningTotal input').val());
}
else {
officeCleaning = parseInt($('.officeCleaningTotal .cf-field').text());
}
//store the hidden totals fields into the array
var data = google.visualization.arrayToDataTable([
['Task','Hours'],
['Window Cleaning',windowCleaning],
['Table Cleaning',tableCleaning],
['Floor Cleaning',floorCleaning],
['Office Cleaning',officeCleaning]
]);
//set the chart title
var options = {
title: 'Service Tasks'
};
//update the pie chart
var chart = new google.visualization.PieChart(document.getElementById('piechart'));
chart.draw(data, options);
}
}
});
Thank you for your effort but no success.
Best Regards,
Mazahir
hmmm... weird, it works for me. What version of Forms are you using? I'm on 10.2.
My forms Version: 10.2.0.774
Are you working with the code snippets I posted, or modified versions inside your form? If the latter, can you share the code you are using?
$(document).ready(function() {
//load the Google Charts Visualization
$.getScript('http://x.x.x.x:8010/forms/js/loader.js', function () {
setTimeout(updatePieChart, 10);
});
//when anything in the Service Tasks Table changes, update the pie chart
$('.serviceTasksTable').on('change', function() {
setTimeout(updatePieChart, 10);
});
function updatePieChart() {
//pie chart update code
google.charts.load('current', {'packages':['corechart']});
google.charts.setOnLoadCallback(drawChart);
function drawChart() {
//get the pie chart values from the hidden totals fields
//populate the values into the four variables
//if the form is in processing mode, get the input field values
//if the form is in read-only mode, get the text values instead
var windowCleaning, floorCleaning, tableCleaning, officeCleaning;
if (parseInt($('.windowCleaningTotal input').val()) >= 0) {
windowCleaning = parseInt($('.windowCleaningTotal input').val());
}
else {
windowCleaning = parseInt($('.windowCleaningTotal .cf-field').text());
}
if (parseInt($('.floorCleaningTotal input').val()) >= 0) {
floorCleaning = parseInt($('.floorCleaningTotal input').val());
}
else {
floorCleaning = parseInt($('.floorCleaningTotal .cf-field').text());
}
if (parseInt($('.tableCleaningTotal input').val()) >= 0) {
tableCleaning = parseInt($('.tableCleaningTotal input').val());
}
else {
tableCleaning = parseInt($('.tableCleaningTotal .cf-field').text());
}
if (parseInt($('.officeCleaningTotal input').val()) >= 0) {
officeCleaning = parseInt($('.officeCleaningTotal input').val());
}
else {
officeCleaning = parseInt($('.officeCleaningTotal .cf-field').text());
}
//store the hidden totals fields into the array
var data = google.visualization.arrayToDataTable([
['Task','Hours'],
['Window Cleaning',windowCleaning],
['Table Cleaning',tableCleaning],
['Floor Cleaning',floorCleaning],
['Office Cleaning',officeCleaning]
]);
//set the chart title
var options = {
title: 'Service Tasks'
};
//update the pie chart
var chart = new google.visualization.PieChart(document.getElementById('piechart'));
chart.draw(data, options);
}
}
});
hmmm... And the pie chart is loading for you in the display, but not in the "archive to repository" version? Or is it not loading at all? If it is not loading at all, it may be an issue with how the loader.js script is being called. I only suspect this because, the only difference I see in the script you posted versus the original I posted is the call to the getScript command.
Mine: $.getScript('http://FORMSERVER/forms/js/loader.js', function () {
Yours: $.getScript('http://x.x.x.x:8010/forms/js/loader.js', function () {
I'm assuming x.x.x.x is not what you are actually using, but that you replaced this from your real IP address (I don't blame you). But I wonder if the port is needed??? I don't know if that matters at all or not. If the pie chart is not working at all, maybe try it without the port.
Like this: $.getScript('http://x.x.x.x/forms/js/loader.js', function () {
I have no idea if that'll solve it, but since it is the only difference in the script, that's my best guess.
Of course there could be differences in the Layout page that could impact it (i.e. the CSS Class names assigned to the totals fields).
Q: And the pie chart is loading for you in the display?
Ans: Yes
Best Regards,
Mazahir
Okay, yeah, I see it too. The chart works in the "preview of completed form" version inside Forms itself, but not in the "archive to repository" version of the form.
I'm not really certain how to proceed here, previously my forms have always functioned the same in the "preview of completed form" version and the "archive to repository" version.
There isn't a way to "inspect element" in the repository version of the form to try to identify what's failing... ![]()
I don't know what the issue is yet, but here's where I'm at so far.
Typically I uses alert commands ( alert('test'); ) to test whether certain parts of code are occurring or not. That won't work with the "archive to repository" version of the form however. But I figured out an option that does work, adding css rules to change coloring of fields - this line: $('.serviceTasksTable').css('background-color', 'yellow');
By placing this code in the Javascript and moving it around (testing archival of the form between each movement) I was able to determine that the bit of code that is failing to run on the "Archival to Repository" version of the form is line #17:
google.charts.setOnLoadCallback(drawChart);
Why this bit of code is not working, I'm not entirely certain.
The setOnLoadCallback command basically tells the script "wait until this is done loading and then complete these tasks". I'm not certain, but what I think is occurring is that the form archival is being completed before the callback event is generated...
Perhaps we just need to find a way to delay the archival. I just don't know what that is yet.
I worry that it might not be possible, the Google Charts instructions, regarding the callback say: "The loader will also wait for the document to finish loading before calling the callback".
If any of the Laserfiche employees are reading this...
Is there any way to delay the processing of the "Archive to Repository" task that is occurring, because it appears to be happening before our Javascript has finished processing...
This is very cool! Mine is working fine. Thank you.
Hi @Matthew, where does a person download the loader.js file? This looks really cool and would like to try it!
@Gert,
you can get it by this link
"You'll need to store the loader.js file (https://www.gstatic.com/charts/loader.js ) in the js folder on your forms server (C:\Program Files\Laserfiche\Laserfiche Forms\Forms\js)"
In my Dev environment I just set the code to use it online in place to a local URL
//load the Google Charts Visualization
$.getScript('https://www.gstatic.com/charts/loader.js', function() {});
@Rene
How do you use the code in Cloud. I tried this: $.getScript('https://www.gstatic.com/charts/loader.js', function() {}); but doesn't seem to work. I don't see the chart at all.